Takeoff Speeds V1 – VR (Rotate) – V2
In the realm of aviation, takeoff is a critical phase that requires precise coordination and adherence to established safety parameters. Among these parameters are three crucial takeoff speeds: V1, VR (Rotate), and V2. Each speed plays a distinct role in ensuring a smooth and safe lift-off. In this article, we are going to cover the Takeoff speeds in brief. With sequence, we will define V1, VR, and finally V2.
V1 speed
V1 speed is the speed beyond which the takeoff should no longer be aborted. Above V1, the takeoff must be continued unless there is reason to believe that the aircraft will not fly. An engine failure identified before reaching VR speed should always result in a rejected takeoff. The rejected takeoff decision before V1 speed is possible to end with a safe stop within ASDA (accelerate stop distance available). If a reject is initiated at a speed above V1, there is a high risk of runway excursion.
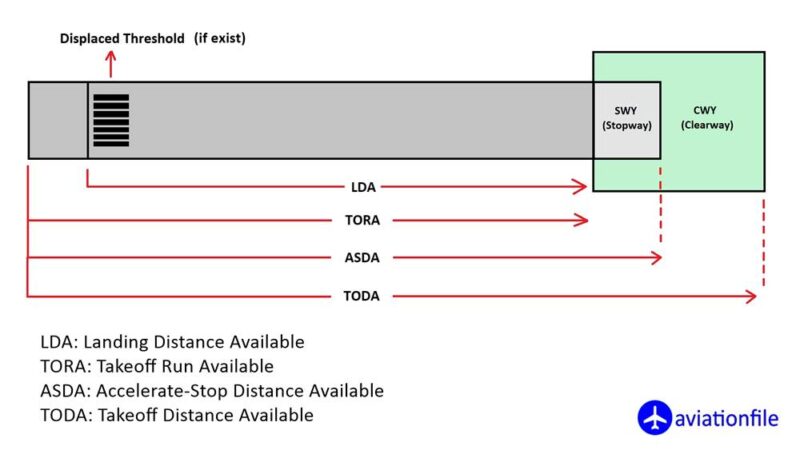
According to the aeromagazine (Aero_11) of Boeing company: “More than half the RTO-Rejected TakeOff accidents and incidents reported in the past 30 years were initiated from a speed in excess of V1.”
VR (Rotation) speed
VR (Rotation) is the speed at which the pilot begins to apply control inputs to cause the aircraft nose to pitch up, after which it will leave the ground. It cannot be less than V1. So again the rejection of takeoff after VR speed likely to result with runway excursion.
V2 speed
V2 is takeoff safety speed. The speed at which the aircraft may safely climb with one engine inoperative. The takeoff safety speed must be attained at the 35 ft. height at the end of the required runway distance.
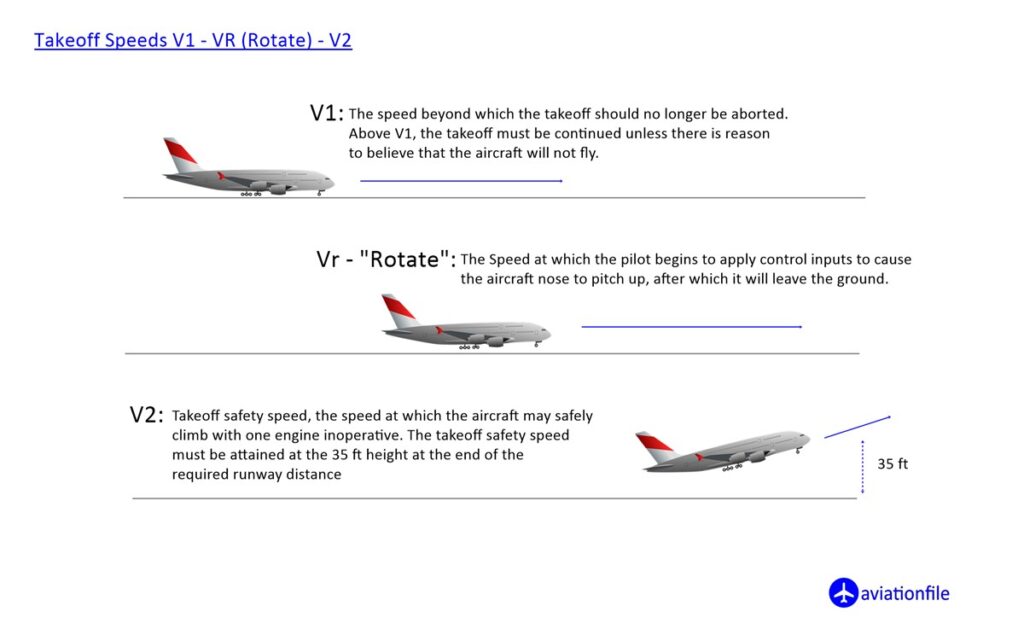
How Pilots Calculate V1, VR, and V2 Speeds for Safe Takeoff
Understanding the calculation of V1, VR, and V2 speeds is essential for a safe and efficient takeoff. These critical speeds are determined based on several factors, including aircraft weight, runway length, and current weather conditions. Before each flight, pilots calculate V1 as the decision speed for a safe stop, VR as the rotation point to lift off, and V2 as the minimum safe climb speed in case of engine failure. By carefully assessing these variables, pilots ensure optimal takeoff performance tailored to their specific flight conditions, enhancing both safety and reliability.
These speeds are interdependent, meaning V1, VR, and V2 are typically calculated together as part of pre-takeoff performance planning. Flight management systems (FMS) or onboard electronic flight bags (EFB) often automate these calculations, factoring in the inputs to provide pilots with precise V-speeds for the specific takeoff scenario.
Understanding the Interplay of V1, VR, and V2
These three takeoff speeds are interconnected and play a critical role in ensuring a safe and successful takeoff. V1 sets the point of no return, VR initiates the nose-up rotation, and V2 guarantees safe climb capability with one engine inoperative. Pilots carefully calculate and adhere to these speeds to minimize the risk of accidents during takeoff.
Remember:
- V1 < VR < V2. They’re like stepping stones to a successful takeoff.
- These speeds depend on factors like aircraft weight, runway length, and weather.
- Pilots carefully calculate them before every flight.
In summary, V1, VR, and V2 are essential takeoff speeds that pilots must carefully consider to ensure a safe and successful liftoff. Understanding their significance and adhering to their prescribed values is paramount for maintaining aviation safety.
Here’s a concise table summarizing the key takeoff speeds:
| Speed | Definition |
|---|---|
| V1 | Decision speed – the maximum speed at which a rejected takeoff can be safely initiated. |
| VR | Rotation speed – the speed at which the pilot begins to lift the nose for takeoff. |
| V2 | Takeoff safety speed – the minimum speed required to safely climb with one engine inoperative. |
o3-mini-high
Analysis of Trends in “Takeoff Speeds” Research: A Web of Science Overview
The two charts presented in this article highlight significant trends in scholarly publications related to the topic of takeoff speeds, as indexed in the Web of Science database. These visualizations provide a detailed overview of how academic interest in this domain has evolved over time and across regions.
Web of Science: A Brief Introduction
The Web of Science is a multidisciplinary research database renowned for its rigorous indexing standards and comprehensive coverage of peer-reviewed literature. It serves as a cornerstone for academic research, enabling scholars to access high-impact journals and track citation trends across a wide range of disciplines.
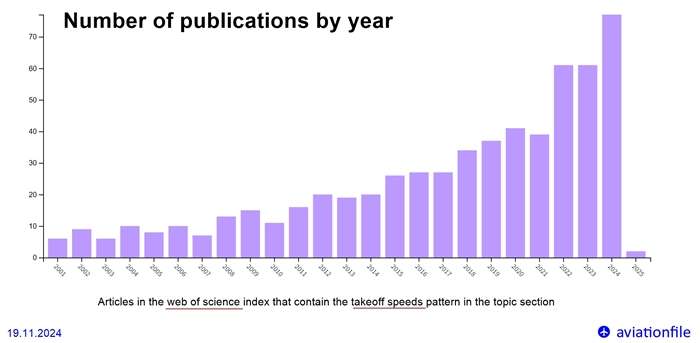
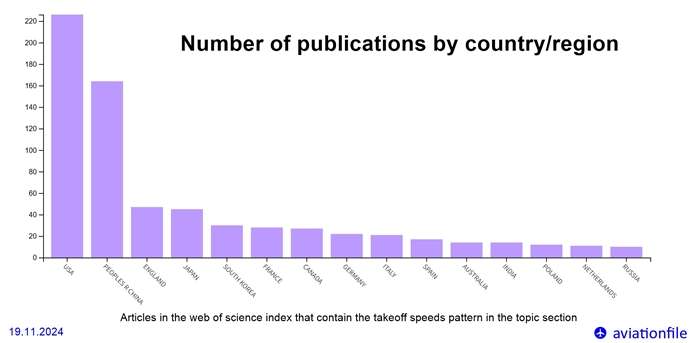
Chart 1: Number of Publications by Year
The first chart illustrates the annual distribution of articles containing the term “takeoff speeds” in their topic sections. This temporal analysis reveals a steady increase in publication volume over the past decades, culminating in a sharp rise in recent years. This trend underscores the growing importance of takeoff speed research in both theoretical and applied contexts, likely driven by advancements in aviation technology and increased air traffic demands.
Chart 2: Number of Publications by Country/Region
The second chart provides a geographical breakdown of the publications. The United States leads the field by a significant margin, followed by China, the United Kingdom, and Japan. This geographic distribution reflects the research priorities of countries with robust aviation industries and highlights the global collaboration shaping advancements in the field.
Key Insights for Researchers and Industry Professionals
By analyzing the publication trends, this study aims to inform researchers, policymakers, and aviation industry stakeholders about the academic landscape surrounding takeoff speeds. These insights are crucial for identifying emerging research hubs, fostering international collaborations, and aligning future studies with industry needs.
References and Further Reading Links
- Federal Aviation Administration (FAA): https://www.law.cornell.edu/cfr/text/14/23.2115
- European Union Aviation Safety Agency (EASA): https://www.easa.europa.eu/en/the-agency/faqs/air-operations
- International Civil Aviation Organization (ICAO): https://www.icao.int/safety/airnavigation/nationalitymarks/annexes_booklet_en.pdf
For more articles.

