MSE, RMSE, R², and MAE in Airline Passenger Forecasting
Forecasting airline passengers helps airlines plan better. It improves ticket pricing, staff management, and route planning. By using machine learning (ML), airlines can make accurate predictions from historical data.
Why Forecasting Airline Passengers Matters
Airlines operate in a competitive and complex industry. Passenger numbers change with seasons, holidays, and global events. Predicting this demand helps reduce costs and increase profits. Better forecasts mean fewer empty seats and happier customers.
How the Forecasting Model Works
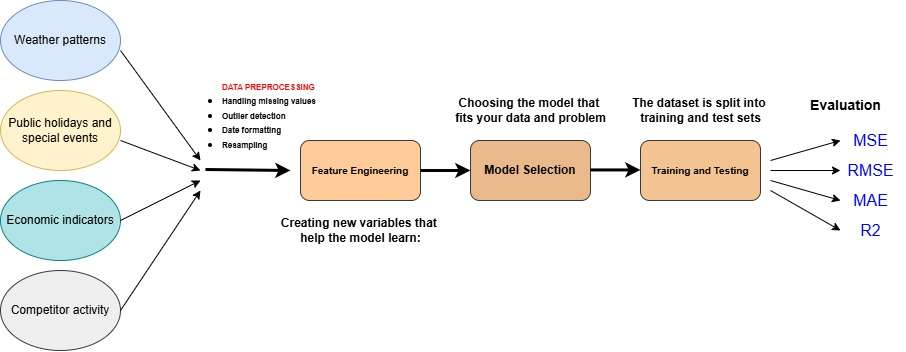
Building a forecasting model involves several key steps. Here’s a deeper look at the machine learning pipeline used in predicting airline passengers:

1. Data Collection
This is the foundation. Historical data on monthly or daily passenger counts is gathered. Data can come from internal airline systems, government transport records, or public datasets like the IATA or Bureau of Transportation Statistics. (Open API Program-IATA)
Other data sources may include:
- Weather patterns
- Public holidays and special events
- Economic indicators (e.g., GDP, unemployment)
- Competitor activity
2. Data Preprocessing
Raw data is rarely clean. This step prepares it for modeling:
- Handling missing values: Fill or remove gaps in the dataset.
- Outlier detection: Remove extreme values that could distort predictions.
- Date formatting: Convert dates to datetime formats.
- Resampling: Convert data to consistent intervals, such as monthly totals.
3. Feature Engineering
This step creates new variables that help the model learn:
- Time features: Month, year, quarter, or day of the week.
- Lag features: Passenger counts from previous months (e.g., t-1, t-2).
- Rolling statistics: Moving averages or standard deviations over time.
- External variables: Weather, promotions, or events that affect demand.
These features help capture trends, seasonality, and patterns in the data.
4. Model Selection
You choose the model that fits your data and problem. Common models include:
- ARIMA: Good for linear trends and seasonality in time series.
- Prophet: A Facebook-developed model that handles trends, holidays, and seasonal changes.
- XGBoost/LightGBM: Gradient boosting models that work well with tabular features.
- LSTM (Long Short-Term Memory): A deep learning model that handles complex time dependencies.
Choosing the right model depends on accuracy needs, training time, and interpretability.
5. Training and Testing
The dataset is split into training and test sets, often using a time-based split. The model is trained on historical data and tested on unseen future data.
Key steps include:
- Hyperparameter tuning: Optimize model settings using tools like GridSearchCV.
- Cross-validation: In time series, this is done with rolling or expanding windows to mimic real forecasting.
6. Evaluation
Finally, the model is evaluated using performance metrics. These show how close the predictions are to actual values. Metrics like MSE, RMSE, MAE, and R² are essential here.
Let’s look at these metrics in detail.
Key Evaluation Metrics
| Metric | Description | Error Sensitivity | Interpretability | Common Use |
|---|---|---|---|---|
| MSE (Mean Squared Error) | Measures average of squared errors. Penalizes large errors more heavily. | High (sensitive to outliers) | Low (result in squared units) | Used when large errors need strong penalties. |
| RMSE (Root Mean Squared Error) | Square root of MSE. Gives error in the same unit as actual data. | High (like MSE) | Medium-High | Commonly used to compare model performance in real-world units. |
| MAE (Mean Absolute Error) | Measures average of absolute errors. Treats all errors equally. | Low (not sensitive to outliers) | High | Useful when consistent accuracy is more important than punishing large errors. |
| R² (R-Squared) | Explains how well the model captures data variance. | N/A (not a direct error measure) | High | Ideal for judging model’s overall fit and explanatory power. |
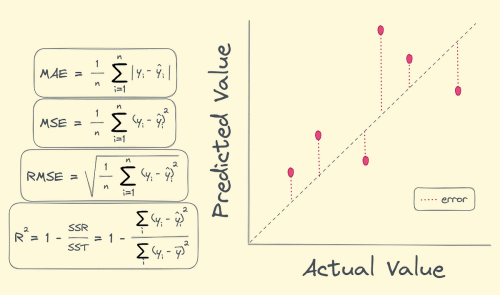
1. Mean Squared Error (MSE)
MSE calculates the average squared difference between actual and predicted values.
Formula:
MSE = (1/n) * Σ(actual – predicted)²
Use:
It penalizes larger errors more, making it sensitive to outliers.
Why It Matters:
A lower MSE indicates better overall performance. However, it’s harder to interpret because the result is in squared units.
2. Root Mean Squared Error (RMSE)
RMSE is simply the square root of MSE. It returns errors in the same unit as the data.
Formula:
RMSE = √MSE
Use:
It gives a clear sense of average error. For example, an RMSE of 800 means predictions are off by about 800 passengers on average.
Why It Matters:
It’s a popular metric for comparing different models due to its interpretability.

Medium-Farshad
3. Mean Absolute Error (MAE)
MAE measures the average of absolute errors, treating all differences equally.
Formula:
MAE = (1/n) * Σ|actual – predicted|
Use:
It’s robust to outliers and easy to explain. MAE gives a simple, direct measure of average prediction error.
Why It Matters:
MAE is useful when you care about the size of the error more than its variance.
4. R-Squared (R²)
R² shows how much of the variation in the data the model explains.
Formula:
R² = 1 – (Σ(actual – predicted)² / Σ(actual – mean)²)
Use:
An R² of 1 means perfect predictions. An R² of 0 means the model predicts no better than the average.
Why It Matters:
It provides a broad view of model performance. Higher R² values show that the model captures patterns well.
| Metric | What’s Considered Good | What Indicates Poor Performance | Interpretation Tip |
|---|---|---|---|
| MSE | Low value | High value (large errors) | Sensitive to large errors; lower is better |
| RMSE | Low value | High value | In same unit as target; helps understand average error size |
| MAE | Low value | High value | Reflects average error without penalizing outliers |
| R² | Close to 1 (e.g., > 0.8) | Close to 0 or negative | Shows how well the model captures data variance |
Recommended article: Airline Industry Goes Digital: Innovations Shaping Modern Air Travel
Conclusion
Airline passenger forecasting is a powerful tool. It supports better business decisions and improves customer experience. By following a structured machine learning workflow—data collection, preprocessing, feature engineering, model selection, and evaluation—you can build effective prediction models.
Using the right metrics like MSE, RMSE, MAE, and R² ensures that the model is not only accurate but also reliable. Together, these metrics provide a complete picture of forecasting performance.


